Table of Contents
Data Concordance
This page summarizes the methods and results of the concordance checks between the following data sets:
- Groningen Immunochip data
- Groningen Sequence data
- BGI Sequence data
Methods & Tools
File Types
All data sets were either generated or converted to VCF files aligned on the build Hg19 of the Human Reference Genome:
- See GoNL_Immunochip_Data_Preparation about how the Immunochip data was processed
- See GATK LiftOverVCF about how to liftover a VCF file from one reference to another
- IMPORTANT: Check your VCF file header as some versions of the GATK liftover tool (e.g. v1.0.5083) might mix the individuals in the header (sort alphabetically rather than preserve original order). If the order is changed, then you should copy/paste the original order from the source VCF file.
Concordance calculation using VCFTools
To calculate the concordance between the different files, VCFTools was used. More specifically:
vcftools --vcf /data/lfrancioli/immunochip/hg19/GvNL.hg19.final.vcf --indv ${sample} --diff /data/lfrancioli/results/pilot/${sample}.human_g1k_v37.immuno.vcf --diff-site-discordance --diff-indv-discordance --diff-discordance-matrix
This computes the concordance per file, site and individual as well as a discordance matrix. This was applied on a sample level so only the file, site and discordance matrix where actually used.
Concordance aggregation using home-made scripts
The output of the VCFTools being per sample, they are useful for single individual QC but not for population level QC. A few scripts were developed in order to easily aggregate the data over a selection of samples files.
vcftools-diff_site-concordance.pl
As its name suggests, this script runs over the individual .diff.site files produced by VCFTools and aggregate their information. The following features are available:
- Per-major report
SNP filtering Report as plain text or tab-delimited
- SNP-major report
SNP filtering Addition of MAF from a plink frq files Addition of SNP ID from a plink bim file Output of shared SNPs only
vcftools-discordance-matrix.py
This script aggregates the discordance matrix files produced by vcftools into one.
Reporting using R scripts
For reporting purpose, R scripts were created. These scripts all take files created using vcftools-diff_site-condordance.pl or vcftools-discordance-matrix.py as input. The following scripts are available:
- plot_shared_loci.R
Plots the shared/unique loci in the two datasets per individual as a barplot Usage: Rscript plot_shared_loci.R --in <concordance_file> --out <out_plot.jpg> [--data1 name_dataset1] [--data2 name_dataset2]
- plot_geno_concordance.R
Plots the genotype concordance between two datasets per individual as a barplot Usage: Rscript plot_geno_concordance.R --in <concordance_file> --out <out_plot.jpg> [--title plot_title]
- plot_discordance_matrix.R
Plots the genotype discordance by "discordance type" (0/0 -> 0/1, 0/0 -> 1/1, 0/1 -> 0/0, etc.) Usage: Rscript plot_discordance_matrix.R --in <discordance_matrix_file> --out <out_plot.jpg> [--data1 dataset1_name] [--data2 dataset2_name] [--show_concordant] [--show unknowns <concordance_file>]
Downloads
All tools developed inhouse at UMCG are available here: http://www.bbmriwiki.nl/svn/data_concordance/
Results - GoNL Pilot
Groningen / BGI
Datasets:
- Groningen
Produced using Groningen pipeline on hg19 SNPs were only filtered for quality > Q10 (to avoid extreme numbers in VCF). It is considered an 'unfiltered' set and is expected to contain many false positives, however sensitivity should be excellent as any SNP not reported at this point will not be detected further in the pipeline.
- BGI
Produced using BGI pipeline on b36, then lifted over to hg19 SNPs filtered using standard BGI filter setup
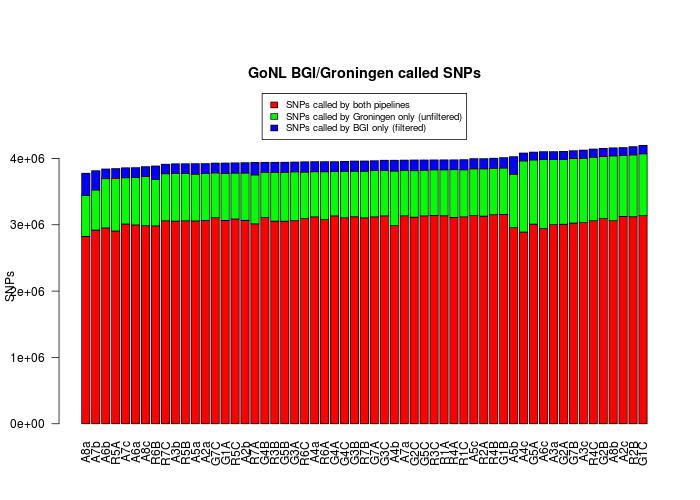
Loci Concordance
Below is a chart showing the shared and unique SNPs in the two datasets regardless of their genotypes. As expected, the vast majority of the SNPs are shared between the datasets, a relatively high number of SNPs are only found in Groningen (amongst them a majority of unfiltered false positives) and a small number of SNPs unique to the BGI dataset (to be investigated).

After investigation, the three least concordant individuals encountered a problem while processing one of their lanes, thus leading to 2/3 of the normal coverage. The figures should be updated when the lanes have been processed and these individuals corrected.
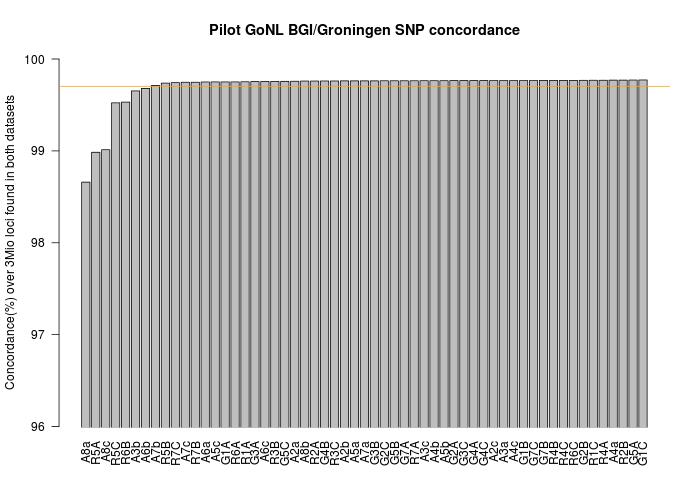
Genotype Concordance
The following chart shows the genotype concordance on the shared SNPs between BGI and Groningen datasets.

Note: The chart above does not take sex chromosomes into account as an artifact introduced by the way the Y-chrom was mapped by BGI was showing all males as completely discordant over the sex chromosomes.
Groningen / Immunochip
Datasets:
- Groningen
Produced using Groningen pipeline on hg19 SNPs were only filtered for quality > Q10 (to avoid extreme numbers in VCF). It is considered an 'unfiltered' set and is expected to contain many false positives, however sensitivity should be excellent as any SNP not reported at this point will not be detected further in the pipeline. Homozygous reference loci corresponding to the Immunochip were added to the dataset as well
- Immunochip
~165K loci after QC (both SNPs and homozygous reference) * SNP HWE p-val > 1e-3 * SNP callrate > 99% Exported from Genome Studio, QC'ed and lifted over from hg18 to hg19
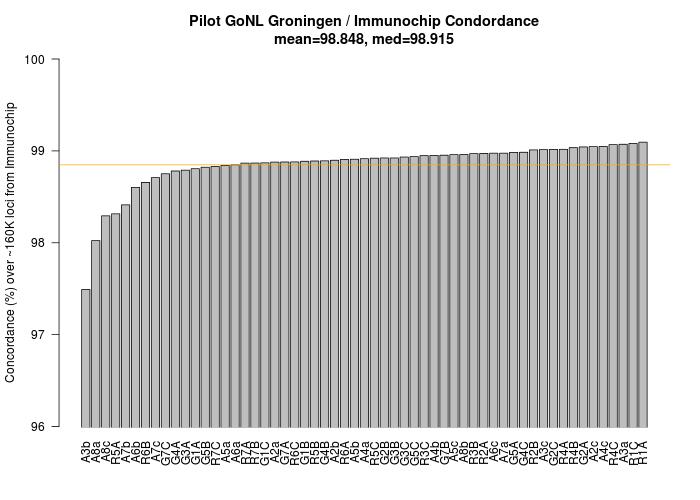
Genotype Concordance
The following chart shows the genotype concordance on the 165K Immunochip loci left after QC.

The 5 least concordant individuals can be explained as follow:
- A3b, A7b samples are contaminated
- A8a,A8c,R5A encountered a problem while processing one of their lanes, thus leading to 2/3 of the normal coverage. The figures should be updated when the lanes have been processed and these individuals corrected.
Moreover, if we exclude the individuals above and filter for sites that are commonly reported by the BGI and Groningen pipelines, the concordance reaches 99.029% on average.
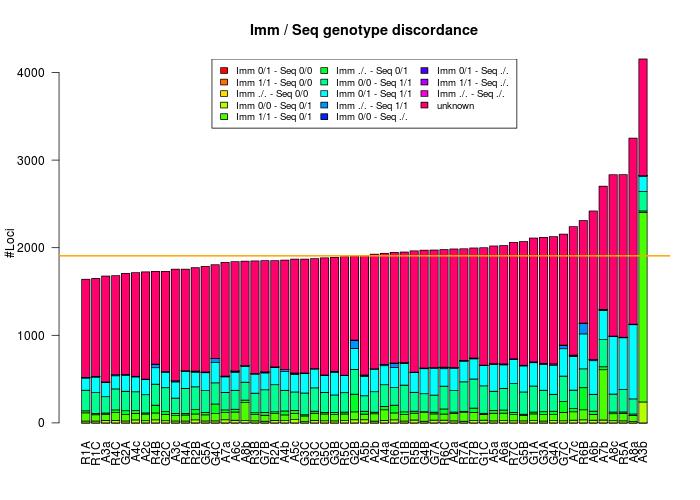
The graph below shows a preliminary analysis of the "types" of discordance observed. An important caveat has to be taken into account: VCFTools only reports sites where the alleles perfectly match. This means that all monomorphic sites in one dataset that are polymorphic in the other will not appear. This was especially problematic since we compared each sequenced sample separately against the whole Immunochip dataset. As a result almost all homozygous reference sites in the sequence data were not reported by VCFTools. All the discordant sites that did not have perfectly matching alleles are reported below as 'unknown' as it has yet to be investigated what discordance "type" they belong to.

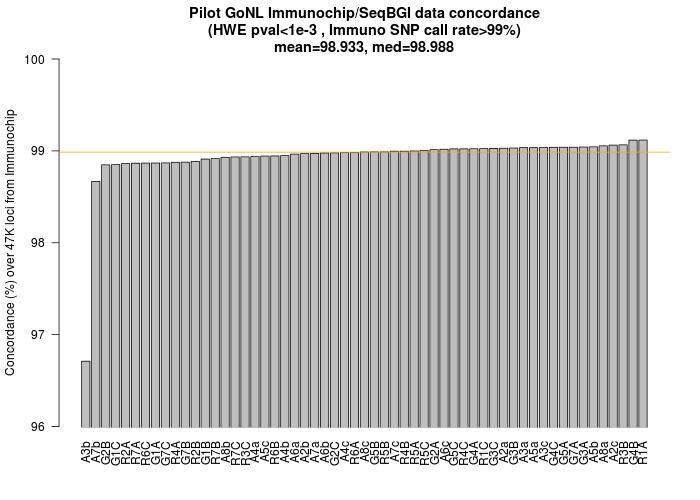
BGI / Immunochip
Datasets:
- BGI
Produced using BGI pipeline on b36, then lifted over to hg19 SNPs filtered using standard BGI filter setup. Note that no homozygous reference locus is reported.
- Immunochip
~165K loci after QC (both SNPs and homozygous reference) * SNP HWE p-val > 1e-3 * SNP callrate > 99% Exported from Genome Studio, QC'ed and lifted over from hg18 to hg19
Genotype Concordance
The following chart shows the concordance between the 2 datasets over ~47K shared loci.

Note that the 2 least concordant samples are explained as being contaminated.
Attachments (6)
- pilot.bgi.nosex.concordance.jpg (58.5 KB) - added by 13 years ago.
- bgi.snps.comparison.jpg (62.8 KB) - added by 13 years ago.
- pilot.immuno_seq.concordance.v2.jpg (53.2 KB) - added by 13 years ago.
- pilot.immuno.seq.gen.concordance.test.jpg (57.7 KB) - added by 13 years ago.
- bgi.immuno_seq.concordance.v2.jpg (56.1 KB) - added by 13 years ago.
- pilot.immuno.seq.gen.concordance.test.2.jpg (57.7 KB) - added by 13 years ago.
Download all attachments as: .zip