Table of Contents
Coverage Analysis Pipeline
Antoine van Kampen, Barbera van Schaik, Silvia D Olabarriaga, Mark Santcroos, AMC
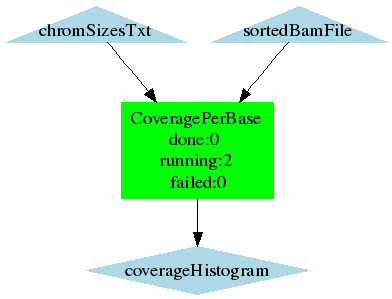
Coverage per base

Description: Calculates coverage per base. Creates a text file which you can use to make a histogram (coverage versus frequency)
Input:
- SortedBamFile, a sorted bam file
- ChromSizesTxt, e.g. the chromInfo.txt from the UCSC database
Output:
- coverageHistogram: summary of coveragePerBase. An overview about the genome coverage of the sequence experiment. Load this into excel/calc/gnuplot/some-other-program to make a graph
Requirements:
- BEDtools - http://code.google.com/p/bedtools/ (v2.9.0 and probably later versions)
Status: Implemented on grid. Source code is made available.
Last modified 13 years ago
Last modified on Oct 27, 2010 8:30:58 PM
Attachments (7)
-
CreateGridDirectory.png (2.9 KB) - added by 14 years ago.
WF CreateGridDirectory?
-
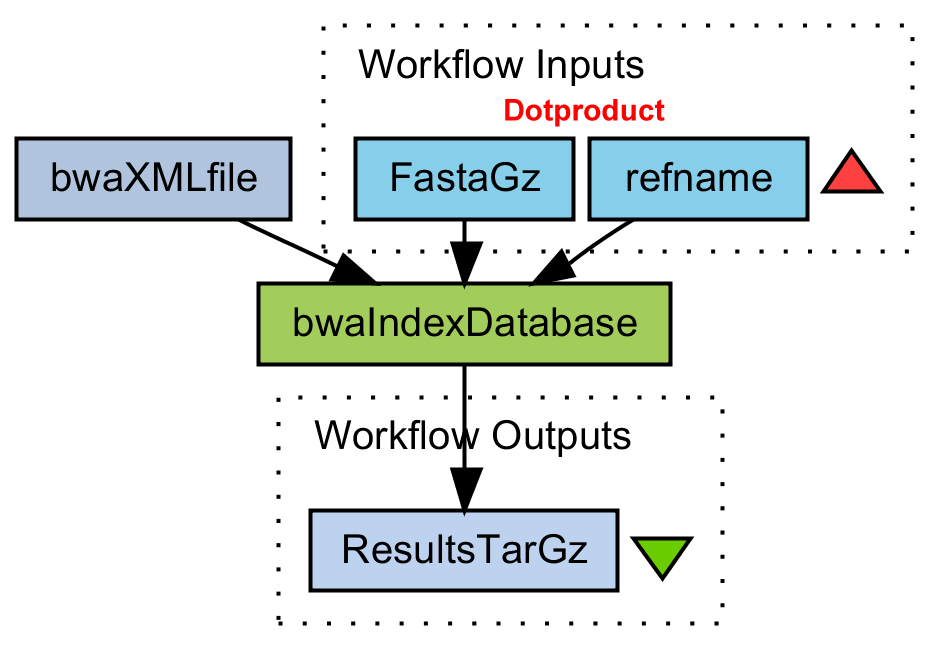
bwaIndexDatabase.png (44.7 KB) - added by 14 years ago.
WF Create BWA index on database
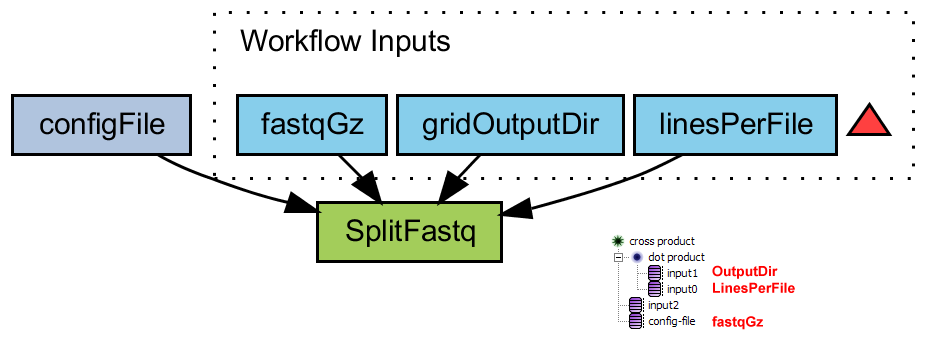
- splitFastq.png (31.0 KB) - added by 14 years ago.
-
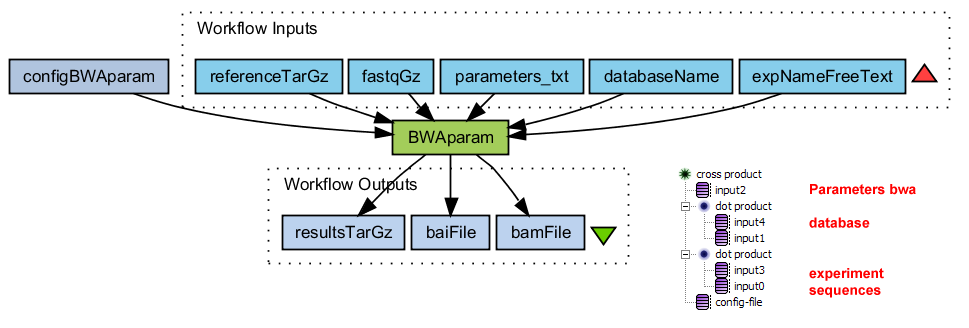
BWAparam.png (39.1 KB) - added by 14 years ago.
WF Alignment with BWA
-
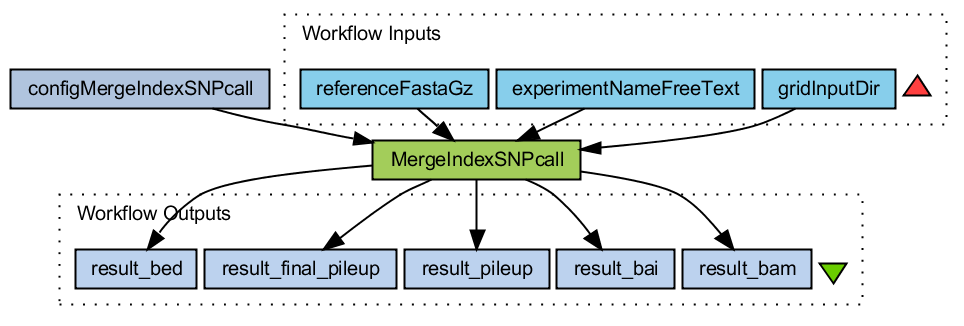
MergeIndexSNPcall.png (36.1 KB) - added by 14 years ago.
WF Merge bam files and call SNPs with samtools
-
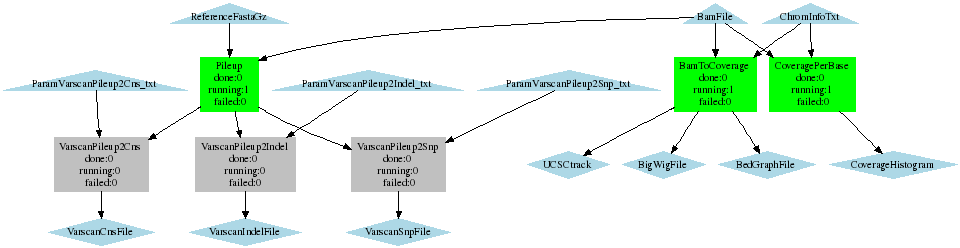
Coverage_Varscan_BaseCoverage.png (8.8 KB) - added by 14 years ago.
WF call SNPs with varscan, calculate coverage per 50kb and per base
- CoveragePerBase.png (4.3 KB) - added by 13 years ago.
Download all attachments as: .zip